flow cytometry surface markers cd11b Search Results


98
Miltenyi Biotec cd11b c fitc
Cd11b C Fitc, supplied by Miltenyi Biotec, used in various techniques. Bioz Stars score: 98/100, based on 1 PubMed citations. ZERO BIAS - scores, article reviews, protocol conditions and more
https://www.bioz.com/result/cd11b c fitc/product/Miltenyi Biotec
Average 98 stars, based on 1 article reviews
cd11b c fitc - by Bioz Stars, 2026-06
98/100 stars
  Buy from Supplier

96
Santa Cruz Biotechnology cd11b fitc
Isolation of glass-adherent <t>CD11b+</t> macrophages from peripheral blood mononuclear cells (PBMCs). The PBMCs were cultured in a glass dish and cell specific phenotypes were analyzed. “Before’ refers to the phenotype analysis in the freshly collected PBMCs; ‘After’ refer to the phenotype analysis of the glass-adherent cells following 72 h culture and removal of the supernatant and non-adherent cells. After 72 h, the adherent cells were washed three times with fresh RPMI media and used in our further studies to determine the salt-effects. Increased macrophage phenotype (CD11b, A) in the adherent cells, along with decreased CD4+T cells (B), CD8+T cells (C), CD19+B cells (D), CD56+NK cells (E) and MPO (F, myeloperoxidase, leukocyte marker) in the adherent cells. Data represented mean values ± SEM from five independent experiments. Student- t -test performed for statistical analysis (significance p<0.05).
Cd11b Fitc, supplied by Santa Cruz Biotechnology, used in various techniques. Bioz Stars score: 96/100, based on 1 PubMed citations. ZERO BIAS - scores, article reviews, protocol conditions and more
https://www.bioz.com/result/cd11b fitc/product/Santa Cruz Biotechnology
Average 96 stars, based on 1 article reviews
cd11b fitc - by Bioz Stars, 2026-06
96/100 stars
  Buy from Supplier

93
SouthernBiotech apc rat anti mouse cd11b
Gating strategy for in vivo phagocytosis assay A549 cells are used to construct a mouse subcutaneous xenograft model. The phagocytosis efficiency is represented by the percentage of GFP + F4/80 + <t>CD11b</t> + cells in total F4/80 + CD11b + cells.
Apc Rat Anti Mouse Cd11b, supplied by SouthernBiotech, used in various techniques. Bioz Stars score: 93/100, based on 1 PubMed citations. ZERO BIAS - scores, article reviews, protocol conditions and more
https://www.bioz.com/result/apc rat anti mouse cd11b/product/SouthernBiotech
Average 93 stars, based on 1 article reviews
apc rat anti mouse cd11b - by Bioz Stars, 2026-06
93/100 stars
  Buy from Supplier

95
Miltenyi Biotec anti mouse cd11b macs beads
PTEC DN-RAR mice underwent rhabdo or bilateral IRI-AKI, and kidneys harvested after 3 days. A-D, Increased F4/80 staining in the kidney after rhabdo- and IRI-AKI. A/B, F4/80 staining in uninjured mice (Ctrl) and after rhabdo-AKI (Rh-AKI). Area staining with F4/80 in the OSOM, and representative images showing F4/80, Sox9, and LTL staining. Left hand panels show F4/80 staining is largely restricted to the OSOM. Right hand panels show higher magnification of the OSOM. C/D, F4/80 staining after bilateral IRI-AKI. Quantification, and images showing F4/80 and LTL staining in the OSOM. Results expressed as means +/- SEM, individual data points shown. A/C, 1-way ANOVA, if p <0.05, q values shown for between group comparisons. Scale bars=100μM. E-F, Decreased expression of inflammatory markers in <t>CD11B+</t> cells after IRI-AKI. PTEC DN-RAR mice underwent bilateral IRI-AKI, and bulk RNA seq performed on renal CD11B + cells 3 days after injury. E, Gene set enrichment analysis (GSEA) of downregulated genes using Gene Ontology (GO) datasets. F, GSEA for validated pro-inflammatory (“M1”), and anti-inflammatory (“M2”) gene sets in the RNA seq data. Set size=no. of genes from each gene set that are represented. NES=normalized expression score for the gene set sizes. G/H, Volcano plots showing fold change in expression of core enrichment gene from the CD11B+ bulk RNA seq dataset. Dotted line indicates p<0.05.
Anti Mouse Cd11b Macs Beads, supplied by Miltenyi Biotec, used in various techniques. Bioz Stars score: 95/100, based on 1 PubMed citations. ZERO BIAS - scores, article reviews, protocol conditions and more
https://www.bioz.com/result/anti mouse cd11b macs beads/product/Miltenyi Biotec
Average 95 stars, based on 1 article reviews
anti mouse cd11b macs beads - by Bioz Stars, 2026-06
95/100 stars
  Buy from Supplier

94
Revvity cd11b
(A) Timeline for using Cx3cr1 CreER driver to target myeloid cell inducible Tgfb1 loss (samples were harvested at 3 weeks post TAM). (B) Gating strategy for identifying the myeloid cells in single-cell suspension. Cells were first gated according to FSC-SSC, then restricted to singles cells and live cells. Myeloid cells were identified as CD45+ <t>CD11b+.</t> (C, D) FACS analyses of TGF-β expression by myeloid cells in the spleen (top histograms) and in the CNS (lower histograms). The fluorescence minus one (FMO) is represented in black histograms and TGF-β immunostaining is shown in red. TGF-β staining above the background (FMO) is shown in solid red and represents the percentage shown for each analysis. (E, F) Compilation of TGF-β expression by flow cytometry on myeloid cells from the spleen and CNS of WT and KO mice. (G) ELISA quantification (pg/µg total protein) from serum and tissue from the spleen and brain (n = 3 mice per group) showing no difference in TGF-β protein levels in serum or spleen of Cx3cr1CreER- tgfb1 iKO or control mice and that the brain TGF-β ligand levels are below the detection limit of the kit. Mean±SE, Student’s t-test (each data point represents a single animal).
Cd11b, supplied by Revvity, used in various techniques. Bioz Stars score: 94/100, based on 1 PubMed citations. ZERO BIAS - scores, article reviews, protocol conditions and more
https://www.bioz.com/result/cd11b/product/Revvity
Average 94 stars, based on 1 article reviews
cd11b - by Bioz Stars, 2026-06
94/100 stars
  Buy from Supplier

96
Miltenyi Biotec cd11b microglia microbeads
Comparison of purity and yield among microglial cell isolation techniques. A , Schematic of the experimental design. Cx3cr1-NuTRAP brains were enzymatically and mechanically dissociated to create a single-cell suspension. Different microglial sorting techniques were compared with Cell-Input for purity, yield, and transcriptomic signatures. B , Representative flow cytometry plots of immunostained single-cell suspensions from input and after each of the sorting strategies shows a distinct population of eGFP + cells (identified as Cx3cr1 + microglia) and <t>CD11b</t> + CD45 + cells (identified as microglia per traditional cell surface markers, as shown by IHC in Extended Data ). Assessment of the loss of eGFP in circulating CD11b + CD45 + cells 60 d after Tam induction (Extended Data ) and the relative levels of CD45 mid and CD45 high cell populations from the CD11b + CD45 + each sort method and cell input from brain (Extended Data ) were also performed to further characterize the sort fractions. Representative plots of the gating strategies used for the Tyto sort (Extended Data ), FACSAria sort (Extended Data ), and flow cytometry (Extended Data ) are given as supplements. C , D , All sort positive fractions were enriched for ( C ) eGFP + singlets and ( D ) CD11b + CD45 + singlets (as compared with input; two-way ANOVA, main effect of TRAP fraction, * p < 0.05, *** p < 0.001; Extended Data ). When comparing positive fractions, the autoMACS positive fraction had lower % eGFP + singlets as compared with all other sort methods. FACSAria had higher percentage of eGFP + singlets than all other sort methods. FACSAria had higher percentage of CD11b + CD45 + singlets as compared with all other sort methods positive fractions (two-way ANOVA, Tukey’s post hoc test, * p < 0.05). E , Microglial yield was significantly higher in the MACSQuant Tyto positive fraction as compared with the autoMACS to MACSQuant Tyto and FACSAria positive fractions (one-way ANOVA, Tukey’s post hoc test, # p < 0.01). Created with BioRender.com.
Cd11b Microglia Microbeads, supplied by Miltenyi Biotec, used in various techniques. Bioz Stars score: 96/100, based on 1 PubMed citations. ZERO BIAS - scores, article reviews, protocol conditions and more
https://www.bioz.com/result/cd11b microglia microbeads/product/Miltenyi Biotec
Average 96 stars, based on 1 article reviews
cd11b microglia microbeads - by Bioz Stars, 2026-06
96/100 stars
  Buy from Supplier

94
Miltenyi Biotec nhp
( A ) Brain tissue pieces were collected from the indicated brain regions and dissociated by mechanical disruption and enzymatic digestion. A CNS single-cell suspension was generated after Percoll separation. CD3 + T cells were positively selected and used for a CNS T cell QVOA. BrMCs and MG were isolated from the CD3 – fractions <t>by</t> <t>CD11b</t> + selection and by TMEM119 + selection, respectively. For human brains, CD11b + selection was performed to isolate BrMCs. BrMCs or MG at P0 (collected immediately after isolation) were used for purity and phenotype analysis and for RT-qPCR to measure proviral DNA and cell-associated RNA. BrMCs or MG at P1 were cultured 1–2 weeks ex vivo to allow the cells to recover and attach. P1 cells were used for the LRA study and the QVOA. ( B ) MG isolated from ART-suppressed, SIV-infected rhesus macaques were defined by TMEM119 staining (P1 MG) (scale bar: 100 μm) and ( C ) anti-TMEM119/anti-CD11b flow cytometry (P0 MG). ( D ) <t>NHP</t> MG proliferated ex vivo. ( E ) Total and integrated SIV DNA was detectable in isolated P0 MG ( n = 3). ( F ) SIV RNA was induced in isolated P1 MG 7 days after stimulation by the HDACi SAHA (500 nM), but was poorly induced by the canonical NF-κB agonist PEP005 (12 nM), the noncanonical NF-κB agonist AZD5582 (100 nM), or TNF-α (50 ng/mL). *** P < 0.001 compared with mock treatment, by 1-way ANOVA ( n = 3). ( G ) SIV RNA was recovered from the supernatant of NHP P1 MG cocultured with CEM174 ( n = 3). Data are presented as the mean ± SEM.
Nhp, supplied by Miltenyi Biotec, used in various techniques. Bioz Stars score: 94/100, based on 1 PubMed citations. ZERO BIAS - scores, article reviews, protocol conditions and more
https://www.bioz.com/result/nhp/product/Miltenyi Biotec
Average 94 stars, based on 1 article reviews
nhp - by Bioz Stars, 2026-06
94/100 stars
  Buy from Supplier

90
R&D Systems anti cd11b apc
( A ) Brain tissue pieces were collected from the indicated brain regions and dissociated by mechanical disruption and enzymatic digestion. A CNS single-cell suspension was generated after Percoll separation. CD3 + T cells were positively selected and used for a CNS T cell QVOA. BrMCs and MG were isolated from the CD3 – fractions <t>by</t> <t>CD11b</t> + selection and by TMEM119 + selection, respectively. For human brains, CD11b + selection was performed to isolate BrMCs. BrMCs or MG at P0 (collected immediately after isolation) were used for purity and phenotype analysis and for RT-qPCR to measure proviral DNA and cell-associated RNA. BrMCs or MG at P1 were cultured 1–2 weeks ex vivo to allow the cells to recover and attach. P1 cells were used for the LRA study and the QVOA. ( B ) MG isolated from ART-suppressed, SIV-infected rhesus macaques were defined by TMEM119 staining (P1 MG) (scale bar: 100 μm) and ( C ) anti-TMEM119/anti-CD11b flow cytometry (P0 MG). ( D ) <t>NHP</t> MG proliferated ex vivo. ( E ) Total and integrated SIV DNA was detectable in isolated P0 MG ( n = 3). ( F ) SIV RNA was induced in isolated P1 MG 7 days after stimulation by the HDACi SAHA (500 nM), but was poorly induced by the canonical NF-κB agonist PEP005 (12 nM), the noncanonical NF-κB agonist AZD5582 (100 nM), or TNF-α (50 ng/mL). *** P < 0.001 compared with mock treatment, by 1-way ANOVA ( n = 3). ( G ) SIV RNA was recovered from the supernatant of NHP P1 MG cocultured with CEM174 ( n = 3). Data are presented as the mean ± SEM.
Anti Cd11b Apc, supplied by R&D Systems, used in various techniques. Bioz Stars score: 90/100, based on 1 PubMed citations. ZERO BIAS - scores, article reviews, protocol conditions and more
https://www.bioz.com/result/anti cd11b apc/product/R&D Systems
Average 90 stars, based on 1 article reviews
anti cd11b apc - by Bioz Stars, 2026-06
90/100 stars
  Buy from Supplier

90
Becton Dickinson cd235a/gpa
( A ) Brain tissue pieces were collected from the indicated brain regions and dissociated by mechanical disruption and enzymatic digestion. A CNS single-cell suspension was generated after Percoll separation. CD3 + T cells were positively selected and used for a CNS T cell QVOA. BrMCs and MG were isolated from the CD3 – fractions <t>by</t> <t>CD11b</t> + selection and by TMEM119 + selection, respectively. For human brains, CD11b + selection was performed to isolate BrMCs. BrMCs or MG at P0 (collected immediately after isolation) were used for purity and phenotype analysis and for RT-qPCR to measure proviral DNA and cell-associated RNA. BrMCs or MG at P1 were cultured 1–2 weeks ex vivo to allow the cells to recover and attach. P1 cells were used for the LRA study and the QVOA. ( B ) MG isolated from ART-suppressed, SIV-infected rhesus macaques were defined by TMEM119 staining (P1 MG) (scale bar: 100 μm) and ( C ) anti-TMEM119/anti-CD11b flow cytometry (P0 MG). ( D ) <t>NHP</t> MG proliferated ex vivo. ( E ) Total and integrated SIV DNA was detectable in isolated P0 MG ( n = 3). ( F ) SIV RNA was induced in isolated P1 MG 7 days after stimulation by the HDACi SAHA (500 nM), but was poorly induced by the canonical NF-κB agonist PEP005 (12 nM), the noncanonical NF-κB agonist AZD5582 (100 nM), or TNF-α (50 ng/mL). *** P < 0.001 compared with mock treatment, by 1-way ANOVA ( n = 3). ( G ) SIV RNA was recovered from the supernatant of NHP P1 MG cocultured with CEM174 ( n = 3). Data are presented as the mean ± SEM.
Cd235a/Gpa, supplied by Becton Dickinson, used in various techniques. Bioz Stars score: 90/100, based on 1 PubMed citations. ZERO BIAS - scores, article reviews, protocol conditions and more
https://www.bioz.com/result/cd235a/gpa/product/Becton Dickinson
Average 90 stars, based on 1 article reviews
cd235a/gpa - by Bioz Stars, 2026-06
90/100 stars
  Buy from Supplier

93
Bio-Rad fitc cd11b
Figure 6. Flow cytometry analyses of APCs isolated from human and swine saphenous veins. A and B, Representative flow cytometry gating procedure of hAPC line #1 and sAPC line #1 at P5. Total cell populations and the single cells (singlets) were gated according to FSC-A vs SSC-A and FSC-A vs FSC-H parameters (i and ii). Viable cells were distinguished from dead cells using Fixable Viability Dye eFluor780 (iii) and further gated for selected antigens (iv through xi and iv through xiii). Pericyte, mesenchymal, endothelial, and hematopoietic markers were studied. The FMO control was used in the assessment and gating of CD146+ and PDGFRb+ cells, because of the use of multiple fluorochromes (vii through ix and viii through x). The same approach was used when studying the expression of CD45 and <t>CD11b</t> on sAPCs to exclude hematopoietic cell contamination in the cell culture system (xi through xiii). Data were acquired using FACSCantoII (BD Biosciences) or Novocyte 3000 flow cytometer (ACEA Biosciences, San Diego, CA, USA) and analyzed using the FlowJo v10.3 software. C and D, Flow cytometry histograms for each surface marker in representative hAPC (C) and sAPC lines (D). Negative control staining profiles are shown by the red histograms, whereas specific antibody staining profiles are shown by light blue histograms. Bar graphs show the meanSEM values of 3 hAPC and sAPC lines. E and F, Gating and histograms of fresh isolated swine PB-MNCs and swine PAEC line #1 at P5 used as positive control for the staining of hematopoietic and endothelial markers, respectively. In both cell lines, the negative control staining profile is shown by full red histogram, while the positive staining profile is shown by full light-blue histogram. FSC-A indicates Forward Scatter Area; FSC-H, Forward Scatter Height; FMO, fluorescence minus 1; hAPCs, human adventitial pericytes; PB-MNCs, Peripheral blood mononuclear cells; PDGFRb, platelet-derived growth factor receptor-b; sAPCs, swine adventitial pericytes.
Fitc Cd11b, supplied by Bio-Rad, used in various techniques. Bioz Stars score: 93/100, based on 1 PubMed citations. ZERO BIAS - scores, article reviews, protocol conditions and more
https://www.bioz.com/result/fitc cd11b/product/Bio-Rad
Average 93 stars, based on 1 article reviews
fitc cd11b - by Bioz Stars, 2026-06
93/100 stars
  Buy from Supplier

96
Bio-Rad rat anti mouse cd11b pacific blue
Mouse neonatal primary microglia express microglia-specific markers in culture. a Representative fluorescent photomicrographs showing cell morphology of cultured mouse neonatal primary microglia cells. Green, ionizing calcium-binding adaptor molecule 1 (Iba-1), and blue, DAPI nuclear staining. Scale bars, 50 μm. b Flow cytometry analysis confirmed purity of primary microglia culture. Histogram shows the binding for <t>anti-CD11b</t> compared to the binding for nonspecific IgG. Quantification of four independent microglia cultures confirmed that around 95% of cells were positive for microglia marker CD11b (mean +/− SEM). c Analysis of FcγRs confirmed that almost all microglia express FcγI receptor (CD64), FcγII and FcγIII receptor (CD16/32) (mean +/− SEM)
Rat Anti Mouse Cd11b Pacific Blue, supplied by Bio-Rad, used in various techniques. Bioz Stars score: 96/100, based on 1 PubMed citations. ZERO BIAS - scores, article reviews, protocol conditions and more
https://www.bioz.com/result/rat anti mouse cd11b pacific blue/product/Bio-Rad
Average 96 stars, based on 1 article reviews
rat anti mouse cd11b pacific blue - by Bioz Stars, 2026-06
96/100 stars
  Buy from Supplier

96
Miltenyi Biotec mouse miltenyi biotec 130 093 634 red blood cell lysis solution
Mouse neonatal primary microglia express microglia-specific markers in culture. a Representative fluorescent photomicrographs showing cell morphology of cultured mouse neonatal primary microglia cells. Green, ionizing calcium-binding adaptor molecule 1 (Iba-1), and blue, DAPI nuclear staining. Scale bars, 50 μm. b Flow cytometry analysis confirmed purity of primary microglia culture. Histogram shows the binding for <t>anti-CD11b</t> compared to the binding for nonspecific IgG. Quantification of four independent microglia cultures confirmed that around 95% of cells were positive for microglia marker CD11b (mean +/− SEM). c Analysis of FcγRs confirmed that almost all microglia express FcγI receptor (CD64), FcγII and FcγIII receptor (CD16/32) (mean +/− SEM)
Mouse Miltenyi Biotec 130 093 634 Red Blood Cell Lysis Solution, supplied by Miltenyi Biotec, used in various techniques. Bioz Stars score: 96/100, based on 1 PubMed citations. ZERO BIAS - scores, article reviews, protocol conditions and more
https://www.bioz.com/result/mouse miltenyi biotec 130 093 634 red blood cell lysis solution/product/Miltenyi Biotec
Average 96 stars, based on 1 article reviews
mouse miltenyi biotec 130 093 634 red blood cell lysis solution - by Bioz Stars, 2026-06
96/100 stars
  Buy from Supplier

Image Search Results


Isolation of glass-adherent CD11b+ macrophages from peripheral blood mononuclear cells (PBMCs). The PBMCs were cultured in a glass dish and cell specific phenotypes were analyzed. “Before’ refers to the phenotype analysis in the freshly collected PBMCs; ‘After’ refer to the phenotype analysis of the glass-adherent cells following 72 h culture and removal of the supernatant and non-adherent cells. After 72 h, the adherent cells were washed three times with fresh RPMI media and used in our further studies to determine the salt-effects. Increased macrophage phenotype (CD11b, A) in the adherent cells, along with decreased CD4+T cells (B), CD8+T cells (C), CD19+B cells (D), CD56+NK cells (E) and MPO (F, myeloperoxidase, leukocyte marker) in the adherent cells. Data represented mean values ± SEM from five independent experiments. Student- t -test performed for statistical analysis (significance p<0.05).

Journal: Biochemistry and Biophysics Reports

Article Title: High salt induces anti-inflammatory MΦ2-like phenotype in peripheral macrophages

doi: 10.1016/j.bbrep.2016.05.009

Figure Lengend Snippet: Isolation of glass-adherent CD11b+ macrophages from peripheral blood mononuclear cells (PBMCs). The PBMCs were cultured in a glass dish and cell specific phenotypes were analyzed. “Before’ refers to the phenotype analysis in the freshly collected PBMCs; ‘After’ refer to the phenotype analysis of the glass-adherent cells following 72 h culture and removal of the supernatant and non-adherent cells. After 72 h, the adherent cells were washed three times with fresh RPMI media and used in our further studies to determine the salt-effects. Increased macrophage phenotype (CD11b, A) in the adherent cells, along with decreased CD4+T cells (B), CD8+T cells (C), CD19+B cells (D), CD56+NK cells (E) and MPO (F, myeloperoxidase, leukocyte marker) in the adherent cells. Data represented mean values ± SEM from five independent experiments. Student- t -test performed for statistical analysis (significance p<0.05).

Article Snippet: Antibodies used for flow cytometry consisted of: CD11b-FITC, CD14-PE, and CD16 − PerCP (Santa Cruz), CD25-PE, Foxp3-PE (eBiosciences, San Diego, CA).

Techniques: Isolation, Cell Culture, Marker

High salt induced macrophage phenotype switch from MΦ1 to MΦ2 in the adherent-PBMCs following treatment with varying salt concentration (0.1–0.3 M NaCl) and equimolar mannitol (0.1 M mannitol+0.1 M NaCl). The basal concentration of NaCl in cuture media is 0.1 M. NaCl concentration below 0.1 M is not viable for cell culture. (A) Cell viability analysis of adherent cells from PBMC cultured for 72 h and latter subjected to various treatment condition mentioned above for 48 h. Frequency of CD11b + CD14 + CD16 low cells (B), and CD11b + CD14 low CD16 + cells (C) following various treatment conditions. Flow cytometry analysis for CD14 (D) and CD16 (E) in the CD11b positively selected cells following various treatment conditions mentioned above. Data represented mean values ± SEM from five independent experiments. Student- t -test performed for statistical analysis (significance p<0.05).

Journal: Biochemistry and Biophysics Reports

Article Title: High salt induces anti-inflammatory MΦ2-like phenotype in peripheral macrophages

doi: 10.1016/j.bbrep.2016.05.009

Figure Lengend Snippet: High salt induced macrophage phenotype switch from MΦ1 to MΦ2 in the adherent-PBMCs following treatment with varying salt concentration (0.1–0.3 M NaCl) and equimolar mannitol (0.1 M mannitol+0.1 M NaCl). The basal concentration of NaCl in cuture media is 0.1 M. NaCl concentration below 0.1 M is not viable for cell culture. (A) Cell viability analysis of adherent cells from PBMC cultured for 72 h and latter subjected to various treatment condition mentioned above for 48 h. Frequency of CD11b + CD14 + CD16 low cells (B), and CD11b + CD14 low CD16 + cells (C) following various treatment conditions. Flow cytometry analysis for CD14 (D) and CD16 (E) in the CD11b positively selected cells following various treatment conditions mentioned above. Data represented mean values ± SEM from five independent experiments. Student- t -test performed for statistical analysis (significance p<0.05).

Article Snippet: Antibodies used for flow cytometry consisted of: CD11b-FITC, CD14-PE, and CD16 − PerCP (Santa Cruz), CD25-PE, Foxp3-PE (eBiosciences, San Diego, CA).

Techniques: Concentration Assay, Cell Culture, Flow Cytometry

Reversal of macrophage phenotype following re-treatment with regular (0.1 M NaCl) salt concentration. The adherent macrophages previously cultured in high salt for 48 h, for another 48 h with reversing to regular media (0.1 M NaCl). The macrophage phenotype for expression of CD14 (A) and CD16 (B) in CD11b selected cells have been analyzed. (C, D) The inflammatory chemokines and cytokines (same cytokines and chemokines analyzed in ) were analyzed for their change in expression pattern following re-treatment in regular salt media; ‘0.1 M NaCl (r)’ refers to reversal of salt concentration back to regular salt containing media in the cells pretreated with high (0.2 M NaCl) salt. Data represented mean values ± SEM from five independent experiments. Student- t -test performed for statistical analysis (significance p<0.05).

Journal: Biochemistry and Biophysics Reports

Article Title: High salt induces anti-inflammatory MΦ2-like phenotype in peripheral macrophages

doi: 10.1016/j.bbrep.2016.05.009

Figure Lengend Snippet: Reversal of macrophage phenotype following re-treatment with regular (0.1 M NaCl) salt concentration. The adherent macrophages previously cultured in high salt for 48 h, for another 48 h with reversing to regular media (0.1 M NaCl). The macrophage phenotype for expression of CD14 (A) and CD16 (B) in CD11b selected cells have been analyzed. (C, D) The inflammatory chemokines and cytokines (same cytokines and chemokines analyzed in ) were analyzed for their change in expression pattern following re-treatment in regular salt media; ‘0.1 M NaCl (r)’ refers to reversal of salt concentration back to regular salt containing media in the cells pretreated with high (0.2 M NaCl) salt. Data represented mean values ± SEM from five independent experiments. Student- t -test performed for statistical analysis (significance p<0.05).

Article Snippet: Antibodies used for flow cytometry consisted of: CD11b-FITC, CD14-PE, and CD16 − PerCP (Santa Cruz), CD25-PE, Foxp3-PE (eBiosciences, San Diego, CA).

Techniques: Concentration Assay, Cell Culture, Expressing

Gating strategy for in vivo phagocytosis assay A549 cells are used to construct a mouse subcutaneous xenograft model. The phagocytosis efficiency is represented by the percentage of GFP + F4/80 + CD11b + cells in total F4/80 + CD11b + cells.

Journal: STAR Protocols

Article Title: Protocol for detecting macrophage-mediated cancer cell phagocytosis in vitro and in vivo

doi: 10.1016/j.xpro.2022.101940

Figure Lengend Snippet: Gating strategy for in vivo phagocytosis assay A549 cells are used to construct a mouse subcutaneous xenograft model. The phagocytosis efficiency is represented by the percentage of GFP + F4/80 + CD11b + cells in total F4/80 + CD11b + cells.

Article Snippet: APC Rat Anti-Mouse CD11b (1:100) , SouthernBiotech , 1561-11.

Techniques: In Vivo, Phagocytosis Assay, Construct

Journal: STAR Protocols

Article Title: Protocol for detecting macrophage-mediated cancer cell phagocytosis in vitro and in vivo

doi: 10.1016/j.xpro.2022.101940

Figure Lengend Snippet:

Article Snippet: APC Rat Anti-Mouse CD11b (1:100) , SouthernBiotech , 1561-11.

Techniques: Recombinant, DNA Extraction, Red Blood Cell Lysis, Modification, Cell Culture, Software, Sterility, Real-time Polymerase Chain Reaction, Flow Cytometry

PTEC DN-RAR mice underwent rhabdo or bilateral IRI-AKI, and kidneys harvested after 3 days. A-D, Increased F4/80 staining in the kidney after rhabdo- and IRI-AKI. A/B, F4/80 staining in uninjured mice (Ctrl) and after rhabdo-AKI (Rh-AKI). Area staining with F4/80 in the OSOM, and representative images showing F4/80, Sox9, and LTL staining. Left hand panels show F4/80 staining is largely restricted to the OSOM. Right hand panels show higher magnification of the OSOM. C/D, F4/80 staining after bilateral IRI-AKI. Quantification, and images showing F4/80 and LTL staining in the OSOM. Results expressed as means +/- SEM, individual data points shown. A/C, 1-way ANOVA, if p <0.05, q values shown for between group comparisons. Scale bars=100μM. E-F, Decreased expression of inflammatory markers in CD11B+ cells after IRI-AKI. PTEC DN-RAR mice underwent bilateral IRI-AKI, and bulk RNA seq performed on renal CD11B + cells 3 days after injury. E, Gene set enrichment analysis (GSEA) of downregulated genes using Gene Ontology (GO) datasets. F, GSEA for validated pro-inflammatory (“M1”), and anti-inflammatory (“M2”) gene sets in the RNA seq data. Set size=no. of genes from each gene set that are represented. NES=normalized expression score for the gene set sizes. G/H, Volcano plots showing fold change in expression of core enrichment gene from the CD11B+ bulk RNA seq dataset. Dotted line indicates p<0.05.

Journal: bioRxiv

Article Title: Inhibition of Retinoic Acid Signaling in Proximal Tubular Epithelial cells Protects against Acute Kidney Injury by Enhancing Kim-1-dependent Efferocytosis

doi: 10.1101/2023.06.15.545113

Figure Lengend Snippet: PTEC DN-RAR mice underwent rhabdo or bilateral IRI-AKI, and kidneys harvested after 3 days. A-D, Increased F4/80 staining in the kidney after rhabdo- and IRI-AKI. A/B, F4/80 staining in uninjured mice (Ctrl) and after rhabdo-AKI (Rh-AKI). Area staining with F4/80 in the OSOM, and representative images showing F4/80, Sox9, and LTL staining. Left hand panels show F4/80 staining is largely restricted to the OSOM. Right hand panels show higher magnification of the OSOM. C/D, F4/80 staining after bilateral IRI-AKI. Quantification, and images showing F4/80 and LTL staining in the OSOM. Results expressed as means +/- SEM, individual data points shown. A/C, 1-way ANOVA, if p <0.05, q values shown for between group comparisons. Scale bars=100μM. E-F, Decreased expression of inflammatory markers in CD11B+ cells after IRI-AKI. PTEC DN-RAR mice underwent bilateral IRI-AKI, and bulk RNA seq performed on renal CD11B + cells 3 days after injury. E, Gene set enrichment analysis (GSEA) of downregulated genes using Gene Ontology (GO) datasets. F, GSEA for validated pro-inflammatory (“M1”), and anti-inflammatory (“M2”) gene sets in the RNA seq data. Set size=no. of genes from each gene set that are represented. NES=normalized expression score for the gene set sizes. G/H, Volcano plots showing fold change in expression of core enrichment gene from the CD11B+ bulk RNA seq dataset. Dotted line indicates p<0.05.

Article Snippet: Cells were then incubated with anti-mouse CD11b MACS beads (Miltenyi Biotech, 130-126-725) for 15 minutes, and CD11b+ cells separated by loading cells into MACS separator.

Techniques: Staining, IF-P, Expressing, RNA Sequencing

PTEC DN-RAR mice underwent bilateral IRI-AKI, and bulk RNA seq was performed on CD11B + cells from 3 PEPCK Cre+ and 3 Cre- mouse kidneys 3 days after injury. PCA shows clear separation of Cre+ and Cre- datasets in the first dimension, which accounts for 57% of the variation.

Journal: bioRxiv

Article Title: Inhibition of Retinoic Acid Signaling in Proximal Tubular Epithelial cells Protects against Acute Kidney Injury by Enhancing Kim-1-dependent Efferocytosis

doi: 10.1101/2023.06.15.545113

Figure Lengend Snippet: PTEC DN-RAR mice underwent bilateral IRI-AKI, and bulk RNA seq was performed on CD11B + cells from 3 PEPCK Cre+ and 3 Cre- mouse kidneys 3 days after injury. PCA shows clear separation of Cre+ and Cre- datasets in the first dimension, which accounts for 57% of the variation.

Article Snippet: Cells were then incubated with anti-mouse CD11b MACS beads (Miltenyi Biotech, 130-126-725) for 15 minutes, and CD11b+ cells separated by loading cells into MACS separator.

Techniques: RNA Sequencing

A, CD45 + cells: CD45 vs SSC-A; B, CD45 + single cells: FSC-H vs FSC-A, selected upper line followed by SSC-H vs. SSC-A select upper line; C, Single, CD45 + live cells: DAPI - vs. CD45 + ; D, Exclude CD45 + granulocytes: Ly6G + (granulocytes) and Ly6G - cells (non-granulocytes); E, F4/80 expression in CD11B + ; Ly6G - cells: F4/80 - ; Intermediate (int), 2); high (hi) (3); F-H, Ly6C expression: F, F4/80 - : Ly6C - (1), Int (2), high (3); G, F4/80 Int : Ly6C - (1), Int (2), high (3); H, F4/80 Hi : Ly6C - (1), Int (2), high (3); I-K, MHC-II expression: I, F4/80 - : MHC -- (1), Int (2), high (3); J, F4/80 Int : MHC-II - (1), Int (2), high (3); K, F4/80 Hi : MHC-II - (1), Int (2), high (3).

Journal: bioRxiv

Article Title: Inhibition of Retinoic Acid Signaling in Proximal Tubular Epithelial cells Protects against Acute Kidney Injury by Enhancing Kim-1-dependent Efferocytosis

doi: 10.1101/2023.06.15.545113

Figure Lengend Snippet: A, CD45 + cells: CD45 vs SSC-A; B, CD45 + single cells: FSC-H vs FSC-A, selected upper line followed by SSC-H vs. SSC-A select upper line; C, Single, CD45 + live cells: DAPI - vs. CD45 + ; D, Exclude CD45 + granulocytes: Ly6G + (granulocytes) and Ly6G - cells (non-granulocytes); E, F4/80 expression in CD11B + ; Ly6G - cells: F4/80 - ; Intermediate (int), 2); high (hi) (3); F-H, Ly6C expression: F, F4/80 - : Ly6C - (1), Int (2), high (3); G, F4/80 Int : Ly6C - (1), Int (2), high (3); H, F4/80 Hi : Ly6C - (1), Int (2), high (3); I-K, MHC-II expression: I, F4/80 - : MHC -- (1), Int (2), high (3); J, F4/80 Int : MHC-II - (1), Int (2), high (3); K, F4/80 Hi : MHC-II - (1), Int (2), high (3).

Article Snippet: Cells were then incubated with anti-mouse CD11b MACS beads (Miltenyi Biotech, 130-126-725) for 15 minutes, and CD11b+ cells separated by loading cells into MACS separator.

Techniques: Expressing

Kidneys were harvested from 5 PEPCK Cre+ and 10 Cre- uninjured mice, and from 9 PEPCK Cre+ and 10 Cre- mice 3 days after bilateral IRI-AKI. Tissue was digested and homogenized and evaluated by flow cytometry using antibodies and gating strategy illustrated in . A, Total numbers of live, single CD45+ cells acquired; B, CD11B+ cells; and C, non-granulocytes (CD11B + ; Ly6G - ). Results expressed as means +/- SEM, with individual data points shown. 1-way ANOVA was used to compare between groups, and if p <0.05, q values shown for between group comparisons, corrected for repeated testing.

Journal: bioRxiv

Article Title: Inhibition of Retinoic Acid Signaling in Proximal Tubular Epithelial cells Protects against Acute Kidney Injury by Enhancing Kim-1-dependent Efferocytosis

doi: 10.1101/2023.06.15.545113

Figure Lengend Snippet: Kidneys were harvested from 5 PEPCK Cre+ and 10 Cre- uninjured mice, and from 9 PEPCK Cre+ and 10 Cre- mice 3 days after bilateral IRI-AKI. Tissue was digested and homogenized and evaluated by flow cytometry using antibodies and gating strategy illustrated in . A, Total numbers of live, single CD45+ cells acquired; B, CD11B+ cells; and C, non-granulocytes (CD11B + ; Ly6G - ). Results expressed as means +/- SEM, with individual data points shown. 1-way ANOVA was used to compare between groups, and if p <0.05, q values shown for between group comparisons, corrected for repeated testing.

Article Snippet: Cells were then incubated with anti-mouse CD11b MACS beads (Miltenyi Biotech, 130-126-725) for 15 minutes, and CD11b+ cells separated by loading cells into MACS separator.

Techniques: Flow Cytometry, IF-P

Kidneys were harvested from PTEC DN RAR mice 3 days after bilateral IRI-AKI. Tissue was digested, homogenized, and evaluated by flow cytometry. A/B, F4/80 hi cells (kidney resident macrophages). A, F4/80 hi cells as the % of gated CD11B + CD45 + Ly6G - cells. B, CD11B and F4/80 expression charts in PEPCK Cre+ and Cre- mice after IRI-AKI (% in gated area indicated with *). C-F, Ly6C hi cells (inflammatory monocyte/macrophages) . C, F4/80 - (infiltrating monocytes) Ly6C hi cells, and E, F4/80 int (bone marrow derived macrophages) Ly6C hi cells, as the % of gated F4/80 - and F4/80 int cells, respectively. D/F, CD11B and Ly6C expression charts. G/H, CD206/mannose receptor expression (an M2 activated macrophage marker) . G, CD206 + cells as the % of gated F4/80 hi cells. H, CD11B and CD206 expression charts. Results are expressed as means +/- SEM, with individual datapoints shown. 1-way ANOVA was used to compare between groups, and if p <0.05, q values shown for between group comparisons, corrected for repeated testing.

Journal: bioRxiv

Article Title: Inhibition of Retinoic Acid Signaling in Proximal Tubular Epithelial cells Protects against Acute Kidney Injury by Enhancing Kim-1-dependent Efferocytosis

doi: 10.1101/2023.06.15.545113

Figure Lengend Snippet: Kidneys were harvested from PTEC DN RAR mice 3 days after bilateral IRI-AKI. Tissue was digested, homogenized, and evaluated by flow cytometry. A/B, F4/80 hi cells (kidney resident macrophages). A, F4/80 hi cells as the % of gated CD11B + CD45 + Ly6G - cells. B, CD11B and F4/80 expression charts in PEPCK Cre+ and Cre- mice after IRI-AKI (% in gated area indicated with *). C-F, Ly6C hi cells (inflammatory monocyte/macrophages) . C, F4/80 - (infiltrating monocytes) Ly6C hi cells, and E, F4/80 int (bone marrow derived macrophages) Ly6C hi cells, as the % of gated F4/80 - and F4/80 int cells, respectively. D/F, CD11B and Ly6C expression charts. G/H, CD206/mannose receptor expression (an M2 activated macrophage marker) . G, CD206 + cells as the % of gated F4/80 hi cells. H, CD11B and CD206 expression charts. Results are expressed as means +/- SEM, with individual datapoints shown. 1-way ANOVA was used to compare between groups, and if p <0.05, q values shown for between group comparisons, corrected for repeated testing.

Article Snippet: Cells were then incubated with anti-mouse CD11b MACS beads (Miltenyi Biotech, 130-126-725) for 15 minutes, and CD11b+ cells separated by loading cells into MACS separator.

Techniques: Flow Cytometry, Expressing, Derivative Assay, Marker, IF-P

Kidneys were harvested from PTEC DN RAR mice, uninjured and 3 days after bilateral IRI AKI. Tissue was digested, homogenized, and evaluated by flow cytometry. A/B, MHC-II hi F4/80 hi cells (kidney resident macrophages). A, MHC-II hi as the % of gated F4/80 hi cells. B, Representative CD11B and MHC-II expression chart in PEPCK Cre+ and Cre- mice after IRI-AKI (% in gated area indicated with *). C/D, EdU + F4/80 hi cells (proliferating kidney resident macrophages). C, EdU labeled cells as the % of gated F4/80 hi cells. D, Representative CD11B (Y axis) and EdU (X-axis) staining charts. E/F, Immunofluorescence staining with monocyte and neutrophil markers, Gr-1 and MPO. Kidneys were harvested from PTEC DN RAR mice 3 days after bilateral IRI-AKI and co-labeled with LTL and either Gr-1 (a marker of activated monocytes and neutrophils), or MPO (a marker of neutrophils) antibodies. G/H, G, Quantification of the Gr-1 and MPO+ cells as the % of the total cells counted. Results are expressed as means +/- SEM, with individual datapoints shown. 1-way ANOVA used to compare between groups, and if p <0.05, q values shown for between group comparisons, corrected for repeated testing.

Journal: bioRxiv

Article Title: Inhibition of Retinoic Acid Signaling in Proximal Tubular Epithelial cells Protects against Acute Kidney Injury by Enhancing Kim-1-dependent Efferocytosis

doi: 10.1101/2023.06.15.545113

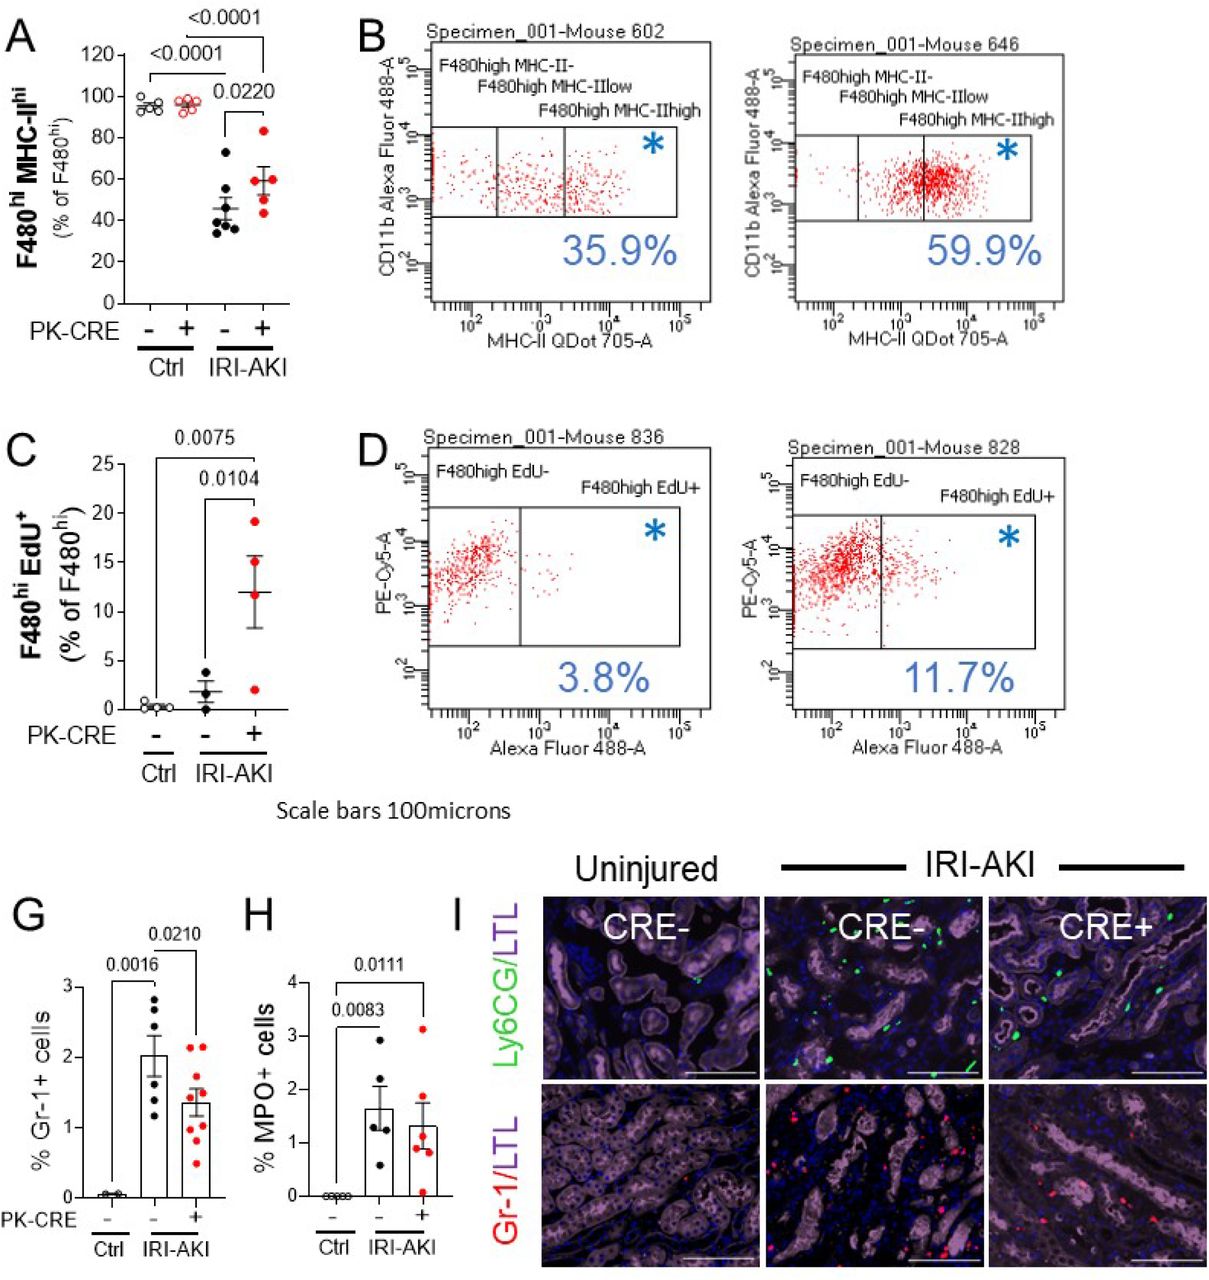
Figure Lengend Snippet: Kidneys were harvested from PTEC DN RAR mice, uninjured and 3 days after bilateral IRI AKI. Tissue was digested, homogenized, and evaluated by flow cytometry. A/B, MHC-II hi F4/80 hi cells (kidney resident macrophages). A, MHC-II hi as the % of gated F4/80 hi cells. B, Representative CD11B and MHC-II expression chart in PEPCK Cre+ and Cre- mice after IRI-AKI (% in gated area indicated with *). C/D, EdU + F4/80 hi cells (proliferating kidney resident macrophages). C, EdU labeled cells as the % of gated F4/80 hi cells. D, Representative CD11B (Y axis) and EdU (X-axis) staining charts. E/F, Immunofluorescence staining with monocyte and neutrophil markers, Gr-1 and MPO. Kidneys were harvested from PTEC DN RAR mice 3 days after bilateral IRI-AKI and co-labeled with LTL and either Gr-1 (a marker of activated monocytes and neutrophils), or MPO (a marker of neutrophils) antibodies. G/H, G, Quantification of the Gr-1 and MPO+ cells as the % of the total cells counted. Results are expressed as means +/- SEM, with individual datapoints shown. 1-way ANOVA used to compare between groups, and if p <0.05, q values shown for between group comparisons, corrected for repeated testing.

Article Snippet: Cells were then incubated with anti-mouse CD11b MACS beads (Miltenyi Biotech, 130-126-725) for 15 minutes, and CD11b+ cells separated by loading cells into MACS separator.

Techniques: Flow Cytometry, Expressing, Labeling, Staining, Immunofluorescence, Marker, IF-P

(A) Timeline for using Cx3cr1 CreER driver to target myeloid cell inducible Tgfb1 loss (samples were harvested at 3 weeks post TAM). (B) Gating strategy for identifying the myeloid cells in single-cell suspension. Cells were first gated according to FSC-SSC, then restricted to singles cells and live cells. Myeloid cells were identified as CD45+ CD11b+. (C, D) FACS analyses of TGF-β expression by myeloid cells in the spleen (top histograms) and in the CNS (lower histograms). The fluorescence minus one (FMO) is represented in black histograms and TGF-β immunostaining is shown in red. TGF-β staining above the background (FMO) is shown in solid red and represents the percentage shown for each analysis. (E, F) Compilation of TGF-β expression by flow cytometry on myeloid cells from the spleen and CNS of WT and KO mice. (G) ELISA quantification (pg/µg total protein) from serum and tissue from the spleen and brain (n = 3 mice per group) showing no difference in TGF-β protein levels in serum or spleen of Cx3cr1CreER- tgfb1 iKO or control mice and that the brain TGF-β ligand levels are below the detection limit of the kit. Mean±SE, Student’s t-test (each data point represents a single animal).

Journal: bioRxiv

Article Title: Microglia-derived TGF-β1 ligand maintains microglia homeostasis via autocrine mechanism and is critical for normal cognitive function in adult mouse brain

doi: 10.1101/2023.07.05.547814

Figure Lengend Snippet: (A) Timeline for using Cx3cr1 CreER driver to target myeloid cell inducible Tgfb1 loss (samples were harvested at 3 weeks post TAM). (B) Gating strategy for identifying the myeloid cells in single-cell suspension. Cells were first gated according to FSC-SSC, then restricted to singles cells and live cells. Myeloid cells were identified as CD45+ CD11b+. (C, D) FACS analyses of TGF-β expression by myeloid cells in the spleen (top histograms) and in the CNS (lower histograms). The fluorescence minus one (FMO) is represented in black histograms and TGF-β immunostaining is shown in red. TGF-β staining above the background (FMO) is shown in solid red and represents the percentage shown for each analysis. (E, F) Compilation of TGF-β expression by flow cytometry on myeloid cells from the spleen and CNS of WT and KO mice. (G) ELISA quantification (pg/µg total protein) from serum and tissue from the spleen and brain (n = 3 mice per group) showing no difference in TGF-β protein levels in serum or spleen of Cx3cr1CreER- tgfb1 iKO or control mice and that the brain TGF-β ligand levels are below the detection limit of the kit. Mean±SE, Student’s t-test (each data point represents a single animal).

Article Snippet: These antibodies included: CD45 (clone 30-F11), CD11b (clone M1/70) and TGF-β1 (clone TW7-16B4) (all from Biolegend).

Techniques: Suspension, Expressing, Fluorescence, Immunostaining, Staining, Flow Cytometry, Enzyme-linked Immunosorbent Assay, Control

Comparison of purity and yield among microglial cell isolation techniques. A , Schematic of the experimental design. Cx3cr1-NuTRAP brains were enzymatically and mechanically dissociated to create a single-cell suspension. Different microglial sorting techniques were compared with Cell-Input for purity, yield, and transcriptomic signatures. B , Representative flow cytometry plots of immunostained single-cell suspensions from input and after each of the sorting strategies shows a distinct population of eGFP + cells (identified as Cx3cr1 + microglia) and CD11b + CD45 + cells (identified as microglia per traditional cell surface markers, as shown by IHC in Extended Data ). Assessment of the loss of eGFP in circulating CD11b + CD45 + cells 60 d after Tam induction (Extended Data ) and the relative levels of CD45 mid and CD45 high cell populations from the CD11b + CD45 + each sort method and cell input from brain (Extended Data ) were also performed to further characterize the sort fractions. Representative plots of the gating strategies used for the Tyto sort (Extended Data ), FACSAria sort (Extended Data ), and flow cytometry (Extended Data ) are given as supplements. C , D , All sort positive fractions were enriched for ( C ) eGFP + singlets and ( D ) CD11b + CD45 + singlets (as compared with input; two-way ANOVA, main effect of TRAP fraction, * p < 0.05, *** p < 0.001; Extended Data ). When comparing positive fractions, the autoMACS positive fraction had lower % eGFP + singlets as compared with all other sort methods. FACSAria had higher percentage of eGFP + singlets than all other sort methods. FACSAria had higher percentage of CD11b + CD45 + singlets as compared with all other sort methods positive fractions (two-way ANOVA, Tukey’s post hoc test, * p < 0.05). E , Microglial yield was significantly higher in the MACSQuant Tyto positive fraction as compared with the autoMACS to MACSQuant Tyto and FACSAria positive fractions (one-way ANOVA, Tukey’s post hoc test, # p < 0.01). Created with BioRender.com.

Journal: eNeuro

Article Title: Minimizing the Ex Vivo Confounds of Cell-Isolation Techniques on Transcriptomic and Translatomic Profiles of Purified Microglia

doi: 10.1523/ENEURO.0348-21.2022

Figure Lengend Snippet: Comparison of purity and yield among microglial cell isolation techniques. A , Schematic of the experimental design. Cx3cr1-NuTRAP brains were enzymatically and mechanically dissociated to create a single-cell suspension. Different microglial sorting techniques were compared with Cell-Input for purity, yield, and transcriptomic signatures. B , Representative flow cytometry plots of immunostained single-cell suspensions from input and after each of the sorting strategies shows a distinct population of eGFP + cells (identified as Cx3cr1 + microglia) and CD11b + CD45 + cells (identified as microglia per traditional cell surface markers, as shown by IHC in Extended Data ). Assessment of the loss of eGFP in circulating CD11b + CD45 + cells 60 d after Tam induction (Extended Data ) and the relative levels of CD45 mid and CD45 high cell populations from the CD11b + CD45 + each sort method and cell input from brain (Extended Data ) were also performed to further characterize the sort fractions. Representative plots of the gating strategies used for the Tyto sort (Extended Data ), FACSAria sort (Extended Data ), and flow cytometry (Extended Data ) are given as supplements. C , D , All sort positive fractions were enriched for ( C ) eGFP + singlets and ( D ) CD11b + CD45 + singlets (as compared with input; two-way ANOVA, main effect of TRAP fraction, * p < 0.05, *** p < 0.001; Extended Data ). When comparing positive fractions, the autoMACS positive fraction had lower % eGFP + singlets as compared with all other sort methods. FACSAria had higher percentage of eGFP + singlets than all other sort methods. FACSAria had higher percentage of CD11b + CD45 + singlets as compared with all other sort methods positive fractions (two-way ANOVA, Tukey’s post hoc test, * p < 0.05). E , Microglial yield was significantly higher in the MACSQuant Tyto positive fraction as compared with the autoMACS to MACSQuant Tyto and FACSAria positive fractions (one-way ANOVA, Tukey’s post hoc test, # p < 0.01). Created with BioRender.com.

Article Snippet: Cells from a single hemisphere of a Cx3cr1-NuTRAP mouse brain were pelleted at 300 × g for 10 min at 4°C and resuspended in 90 μl of 0.5% BSA in D-PBS with 10 μl of CD11b (Microglia) MicroBeads (#130-093-636, Miltenyi Biotec) per 10 7 total cells.

Techniques: Comparison, Cell Isolation, Suspension, Flow Cytometry

( A ) Brain tissue pieces were collected from the indicated brain regions and dissociated by mechanical disruption and enzymatic digestion. A CNS single-cell suspension was generated after Percoll separation. CD3 + T cells were positively selected and used for a CNS T cell QVOA. BrMCs and MG were isolated from the CD3 – fractions by CD11b + selection and by TMEM119 + selection, respectively. For human brains, CD11b + selection was performed to isolate BrMCs. BrMCs or MG at P0 (collected immediately after isolation) were used for purity and phenotype analysis and for RT-qPCR to measure proviral DNA and cell-associated RNA. BrMCs or MG at P1 were cultured 1–2 weeks ex vivo to allow the cells to recover and attach. P1 cells were used for the LRA study and the QVOA. ( B ) MG isolated from ART-suppressed, SIV-infected rhesus macaques were defined by TMEM119 staining (P1 MG) (scale bar: 100 μm) and ( C ) anti-TMEM119/anti-CD11b flow cytometry (P0 MG). ( D ) NHP MG proliferated ex vivo. ( E ) Total and integrated SIV DNA was detectable in isolated P0 MG ( n = 3). ( F ) SIV RNA was induced in isolated P1 MG 7 days after stimulation by the HDACi SAHA (500 nM), but was poorly induced by the canonical NF-κB agonist PEP005 (12 nM), the noncanonical NF-κB agonist AZD5582 (100 nM), or TNF-α (50 ng/mL). *** P < 0.001 compared with mock treatment, by 1-way ANOVA ( n = 3). ( G ) SIV RNA was recovered from the supernatant of NHP P1 MG cocultured with CEM174 ( n = 3). Data are presented as the mean ± SEM.

Journal: The Journal of Clinical Investigation

Article Title: Brain microglia serve as a persistent HIV reservoir despite durable antiretroviral therapy

doi: 10.1172/JCI167417

Figure Lengend Snippet: ( A ) Brain tissue pieces were collected from the indicated brain regions and dissociated by mechanical disruption and enzymatic digestion. A CNS single-cell suspension was generated after Percoll separation. CD3 + T cells were positively selected and used for a CNS T cell QVOA. BrMCs and MG were isolated from the CD3 – fractions by CD11b + selection and by TMEM119 + selection, respectively. For human brains, CD11b + selection was performed to isolate BrMCs. BrMCs or MG at P0 (collected immediately after isolation) were used for purity and phenotype analysis and for RT-qPCR to measure proviral DNA and cell-associated RNA. BrMCs or MG at P1 were cultured 1–2 weeks ex vivo to allow the cells to recover and attach. P1 cells were used for the LRA study and the QVOA. ( B ) MG isolated from ART-suppressed, SIV-infected rhesus macaques were defined by TMEM119 staining (P1 MG) (scale bar: 100 μm) and ( C ) anti-TMEM119/anti-CD11b flow cytometry (P0 MG). ( D ) NHP MG proliferated ex vivo. ( E ) Total and integrated SIV DNA was detectable in isolated P0 MG ( n = 3). ( F ) SIV RNA was induced in isolated P1 MG 7 days after stimulation by the HDACi SAHA (500 nM), but was poorly induced by the canonical NF-κB agonist PEP005 (12 nM), the noncanonical NF-κB agonist AZD5582 (100 nM), or TNF-α (50 ng/mL). *** P < 0.001 compared with mock treatment, by 1-way ANOVA ( n = 3). ( G ) SIV RNA was recovered from the supernatant of NHP P1 MG cocultured with CEM174 ( n = 3). Data are presented as the mean ± SEM.

Article Snippet: For NHP samples, CD11b MicroBeads, NHP (catalog 130-091-100, Miltenyi Biotec) were used ( ).

Techniques: Disruption, Suspension, Generated, Isolation, Selection, Quantitative RT-PCR, Cell Culture, Ex Vivo, Infection, Staining, Flow Cytometry

Figure 6. Flow cytometry analyses of APCs isolated from human and swine saphenous veins. A and B, Representative flow cytometry gating procedure of hAPC line #1 and sAPC line #1 at P5. Total cell populations and the single cells (singlets) were gated according to FSC-A vs SSC-A and FSC-A vs FSC-H parameters (i and ii). Viable cells were distinguished from dead cells using Fixable Viability Dye eFluor780 (iii) and further gated for selected antigens (iv through xi and iv through xiii). Pericyte, mesenchymal, endothelial, and hematopoietic markers were studied. The FMO control was used in the assessment and gating of CD146+ and PDGFRb+ cells, because of the use of multiple fluorochromes (vii through ix and viii through x). The same approach was used when studying the expression of CD45 and CD11b on sAPCs to exclude hematopoietic cell contamination in the cell culture system (xi through xiii). Data were acquired using FACSCantoII (BD Biosciences) or Novocyte 3000 flow cytometer (ACEA Biosciences, San Diego, CA, USA) and analyzed using the FlowJo v10.3 software. C and D, Flow cytometry histograms for each surface marker in representative hAPC (C) and sAPC lines (D). Negative control staining profiles are shown by the red histograms, whereas specific antibody staining profiles are shown by light blue histograms. Bar graphs show the meanSEM values of 3 hAPC and sAPC lines. E and F, Gating and histograms of fresh isolated swine PB-MNCs and swine PAEC line #1 at P5 used as positive control for the staining of hematopoietic and endothelial markers, respectively. In both cell lines, the negative control staining profile is shown by full red histogram, while the positive staining profile is shown by full light-blue histogram. FSC-A indicates Forward Scatter Area; FSC-H, Forward Scatter Height; FMO, fluorescence minus 1; hAPCs, human adventitial pericytes; PB-MNCs, Peripheral blood mononuclear cells; PDGFRb, platelet-derived growth factor receptor-b; sAPCs, swine adventitial pericytes.

Journal: Journal of the American Heart Association

Article Title: Transplantation of Allogeneic Pericytes Improves Myocardial Vascularization and Reduces Interstitial Fibrosis in a Swine Model of Reperfused Acute Myocardial Infarction

doi: 10.1161/jaha.117.006727

Figure Lengend Snippet: Figure 6. Flow cytometry analyses of APCs isolated from human and swine saphenous veins. A and B, Representative flow cytometry gating procedure of hAPC line #1 and sAPC line #1 at P5. Total cell populations and the single cells (singlets) were gated according to FSC-A vs SSC-A and FSC-A vs FSC-H parameters (i and ii). Viable cells were distinguished from dead cells using Fixable Viability Dye eFluor780 (iii) and further gated for selected antigens (iv through xi and iv through xiii). Pericyte, mesenchymal, endothelial, and hematopoietic markers were studied. The FMO control was used in the assessment and gating of CD146+ and PDGFRb+ cells, because of the use of multiple fluorochromes (vii through ix and viii through x). The same approach was used when studying the expression of CD45 and CD11b on sAPCs to exclude hematopoietic cell contamination in the cell culture system (xi through xiii). Data were acquired using FACSCantoII (BD Biosciences) or Novocyte 3000 flow cytometer (ACEA Biosciences, San Diego, CA, USA) and analyzed using the FlowJo v10.3 software. C and D, Flow cytometry histograms for each surface marker in representative hAPC (C) and sAPC lines (D). Negative control staining profiles are shown by the red histograms, whereas specific antibody staining profiles are shown by light blue histograms. Bar graphs show the meanSEM values of 3 hAPC and sAPC lines. E and F, Gating and histograms of fresh isolated swine PB-MNCs and swine PAEC line #1 at P5 used as positive control for the staining of hematopoietic and endothelial markers, respectively. In both cell lines, the negative control staining profile is shown by full red histogram, while the positive staining profile is shown by full light-blue histogram. FSC-A indicates Forward Scatter Area; FSC-H, Forward Scatter Height; FMO, fluorescence minus 1; hAPCs, human adventitial pericytes; PB-MNCs, Peripheral blood mononuclear cells; PDGFRb, platelet-derived growth factor receptor-b; sAPCs, swine adventitial pericytes.

Article Snippet: Antibodies used in flow cytometry studies on sAPCs Marker Permeabilization Reactivity Primary antibody source dilution Fluorophores CD90 No Swine eBioscience, 1:20 Pe-Cy7 CD44 No Swine eBioscience, 1:20 APC CD105 No Swine LifeSpan, 1:5 PE CD45 No Swine Serotec, 1:25 FITC CD11b No Human/Swine eBioscience, 1:20 Pe-Cy7 CD31 No Swine Serotec, 1:80 PE CD146 No Swine Serotec, 1:60 FITC PDGFR No Human Biolegend, 1:25 PE Dye eFluor 780 No eBioscience, 1:1000 APC-Cy7 Cells (1x10⁶, N=3 biological replicates) were washed in 1X DPBS (Life Technologies) and treated with 10X trypsin/EDTA (Life Technologies).

Techniques: Flow Cytometry, Isolation, Cytometry, Control, Expressing, Cell Culture, Software, Marker, Negative Control, Staining, Positive Control, Derivative Assay

Mouse neonatal primary microglia express microglia-specific markers in culture. a Representative fluorescent photomicrographs showing cell morphology of cultured mouse neonatal primary microglia cells. Green, ionizing calcium-binding adaptor molecule 1 (Iba-1), and blue, DAPI nuclear staining. Scale bars, 50 μm. b Flow cytometry analysis confirmed purity of primary microglia culture. Histogram shows the binding for anti-CD11b compared to the binding for nonspecific IgG. Quantification of four independent microglia cultures confirmed that around 95% of cells were positive for microglia marker CD11b (mean +/− SEM). c Analysis of FcγRs confirmed that almost all microglia express FcγI receptor (CD64), FcγII and FcγIII receptor (CD16/32) (mean +/− SEM)

Journal: Acta Neuropathologica Communications

Article Title: Humanized tau antibodies promote tau uptake by human microglia without any increase of inflammation

doi: 10.1186/s40478-020-00948-z

Figure Lengend Snippet: Mouse neonatal primary microglia express microglia-specific markers in culture. a Representative fluorescent photomicrographs showing cell morphology of cultured mouse neonatal primary microglia cells. Green, ionizing calcium-binding adaptor molecule 1 (Iba-1), and blue, DAPI nuclear staining. Scale bars, 50 μm. b Flow cytometry analysis confirmed purity of primary microglia culture. Histogram shows the binding for anti-CD11b compared to the binding for nonspecific IgG. Quantification of four independent microglia cultures confirmed that around 95% of cells were positive for microglia marker CD11b (mean +/− SEM). c Analysis of FcγRs confirmed that almost all microglia express FcγI receptor (CD64), FcγII and FcγIII receptor (CD16/32) (mean +/− SEM)

Article Snippet: Monoclonal mouse antibodies DC8E8 and DC25 [ ], DC51 [ ], DC190 (mapping tau epitope 368–376, Axon Neuroscience SE), rabbit anti-Iba1 (WAKO), blocking antibodies anti-CD16 + CD32 (Abcam) and anti-CD64 (SantaCruz Biotechnologies), rat anti-mouse CD11b Pacific Blue (Biorad), mouse IgG2b isotype control Pacific Blue (Biorad), PE rat anti-mouse CD16/CD32 (BD PharmingenTM), PE mouse IgG2b isotype control (BD PharmingenTM), mouse FcgRIA/CD64a (A594) (R&D systems), and mouse IgG2a isotype control (A594) were used for tau analysis and for mouse microglia.

Techniques: Cell Culture, Binding Assay, Staining, Flow Cytometry, Marker

Human adult primary microglia express specific microglial markers. a Representative fluorescent photomicrographs of human primary microglia culture demonstrating cell morphology and purity of culture; Iba-1 (green), DAPI nuclear staining (blue). Scale bar represents 50 μm. b Flow cytometry analysis for CD11b, CD16, CD32 and CD64 confirmed purity of human microglia cultures. For each marker representative histograms are shown from one human microglia culture and bar graphs with percentage of positive cells from four independent microglia cultures (mean +/− SEM). Histograms and bar graphs show binding and cell positivity for anti-CD11b, −CD16, −CD32 and -CD64, respectively, compared to binding and cell positivity for nonspecific IgG

Journal: Acta Neuropathologica Communications

Article Title: Humanized tau antibodies promote tau uptake by human microglia without any increase of inflammation

doi: 10.1186/s40478-020-00948-z

Figure Lengend Snippet: Human adult primary microglia express specific microglial markers. a Representative fluorescent photomicrographs of human primary microglia culture demonstrating cell morphology and purity of culture; Iba-1 (green), DAPI nuclear staining (blue). Scale bar represents 50 μm. b Flow cytometry analysis for CD11b, CD16, CD32 and CD64 confirmed purity of human microglia cultures. For each marker representative histograms are shown from one human microglia culture and bar graphs with percentage of positive cells from four independent microglia cultures (mean +/− SEM). Histograms and bar graphs show binding and cell positivity for anti-CD11b, −CD16, −CD32 and -CD64, respectively, compared to binding and cell positivity for nonspecific IgG

Article Snippet: Monoclonal mouse antibodies DC8E8 and DC25 [ ], DC51 [ ], DC190 (mapping tau epitope 368–376, Axon Neuroscience SE), rabbit anti-Iba1 (WAKO), blocking antibodies anti-CD16 + CD32 (Abcam) and anti-CD64 (SantaCruz Biotechnologies), rat anti-mouse CD11b Pacific Blue (Biorad), mouse IgG2b isotype control Pacific Blue (Biorad), PE rat anti-mouse CD16/CD32 (BD PharmingenTM), PE mouse IgG2b isotype control (BD PharmingenTM), mouse FcgRIA/CD64a (A594) (R&D systems), and mouse IgG2a isotype control (A594) were used for tau analysis and for mouse microglia.

Techniques: Staining, Flow Cytometry, Marker, Binding Assay